Can technical analysis tell us something about the development of the EUR/GBP currency pair?
To understand better, we will need to take three basic rules into consideration. The first assumes that all information is factored into the price. There is therefore no point in listing all kinds of reasons to explain changes with regard to EUR/GBP. The second rule claims that price movements occur in trends, and the third presupposes that history repeats itself. The latter suggests repeating price patterns.
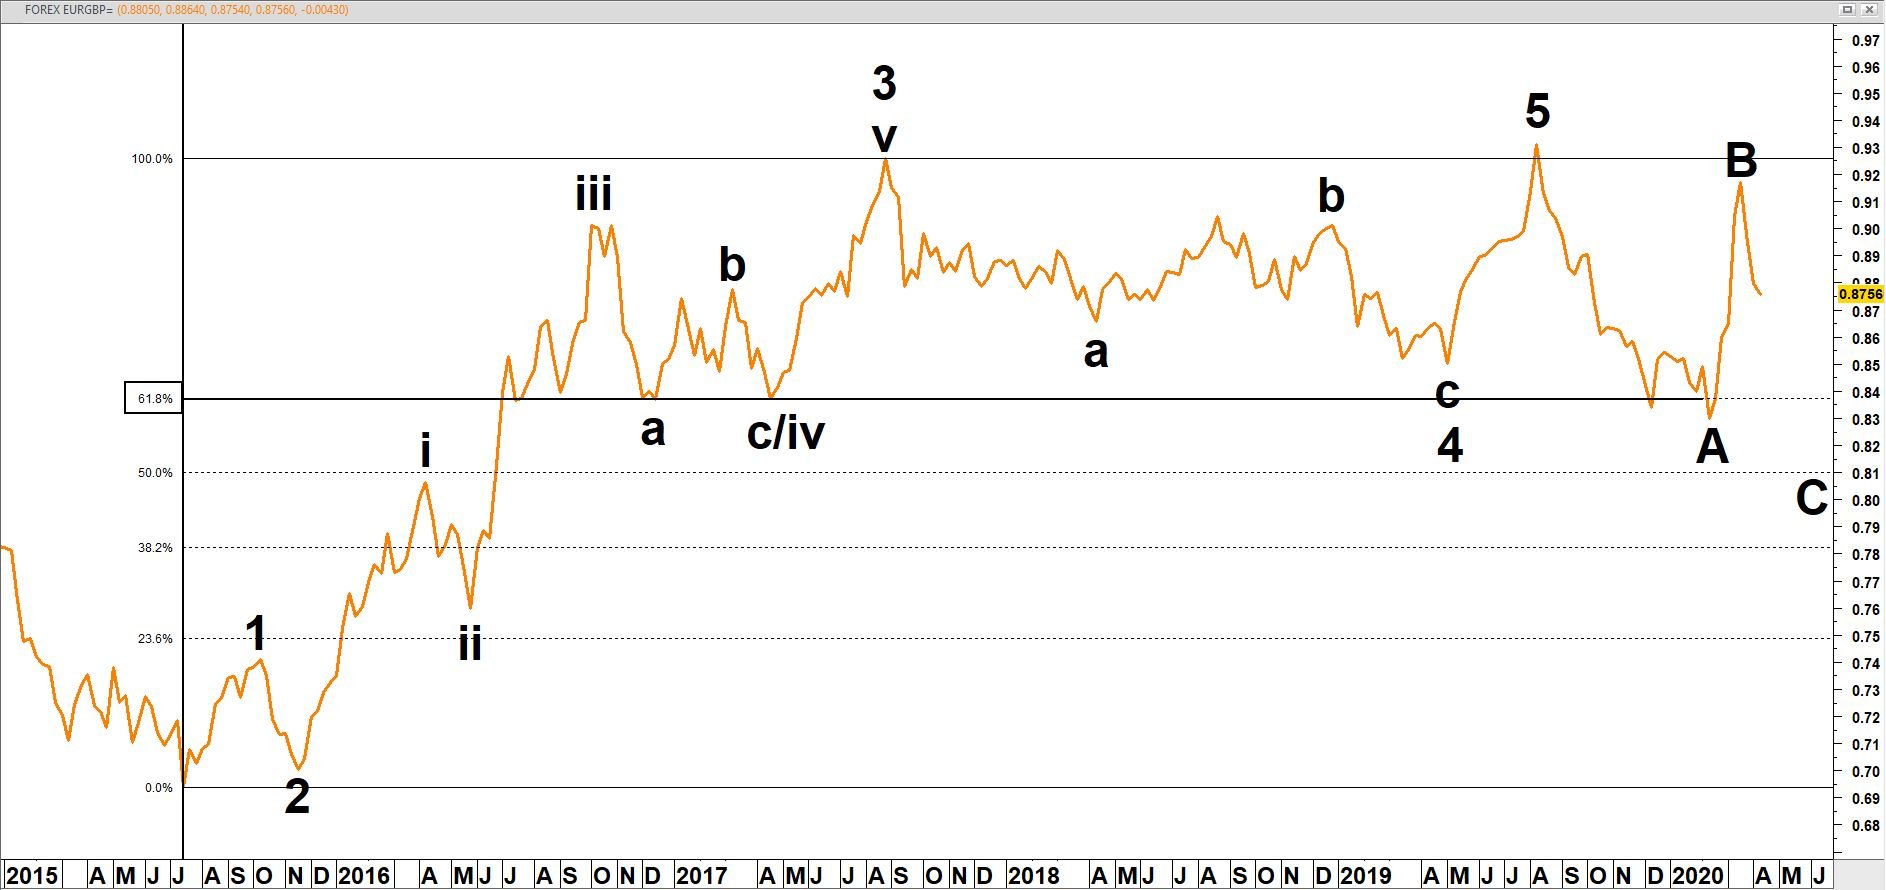
In nature, we see this reflected in the cycle of growth and decay. The basic structure of actions and reactions is characterised by fractal elements. These are similar forms that are replicas of each other. There is a theory that identifies impulse movements by means of three impulse waves that are interrupted by two opposite waves. The sum of this process transforms five waves into a single, complete impulsive movement. This method allows a complete upwards-moving impulse to be identified in the EUR/GBP price chart, from its nadir in 2015 to its zenith in 2019.
Reactions traditionally occur in three waves, two of which are interrupted downwards by an upward surge. The reaction is indicated in letters and is theoretically illustrated as an A-B-C zigzag pattern. Impulse movements, on the other hand, are quantified. The interaction between three and five waves produces a 3:5 ratio and yields the ratio 0.6. This ratio approximates the natural ‘golden mean’ that is produced by the Fibonacci number series 1, 1, 2, 3, 5, 8, 13, and so forth (8/13 = 0.62). This is illustrated in the corrective waves in the EUR/GBP graph, this being i to ii (small scale) and iii to iv (larger scale). In waves 3 to 4 an even larger zigzag pattern can be discerned. Now that wave 5 has been completed a larger A-B-C zigzag pattern appears to be under development. Waves A and B have been completed. Wave C should push EUR/GBP under the bottom of the zigzag ‘A’ in 2020.
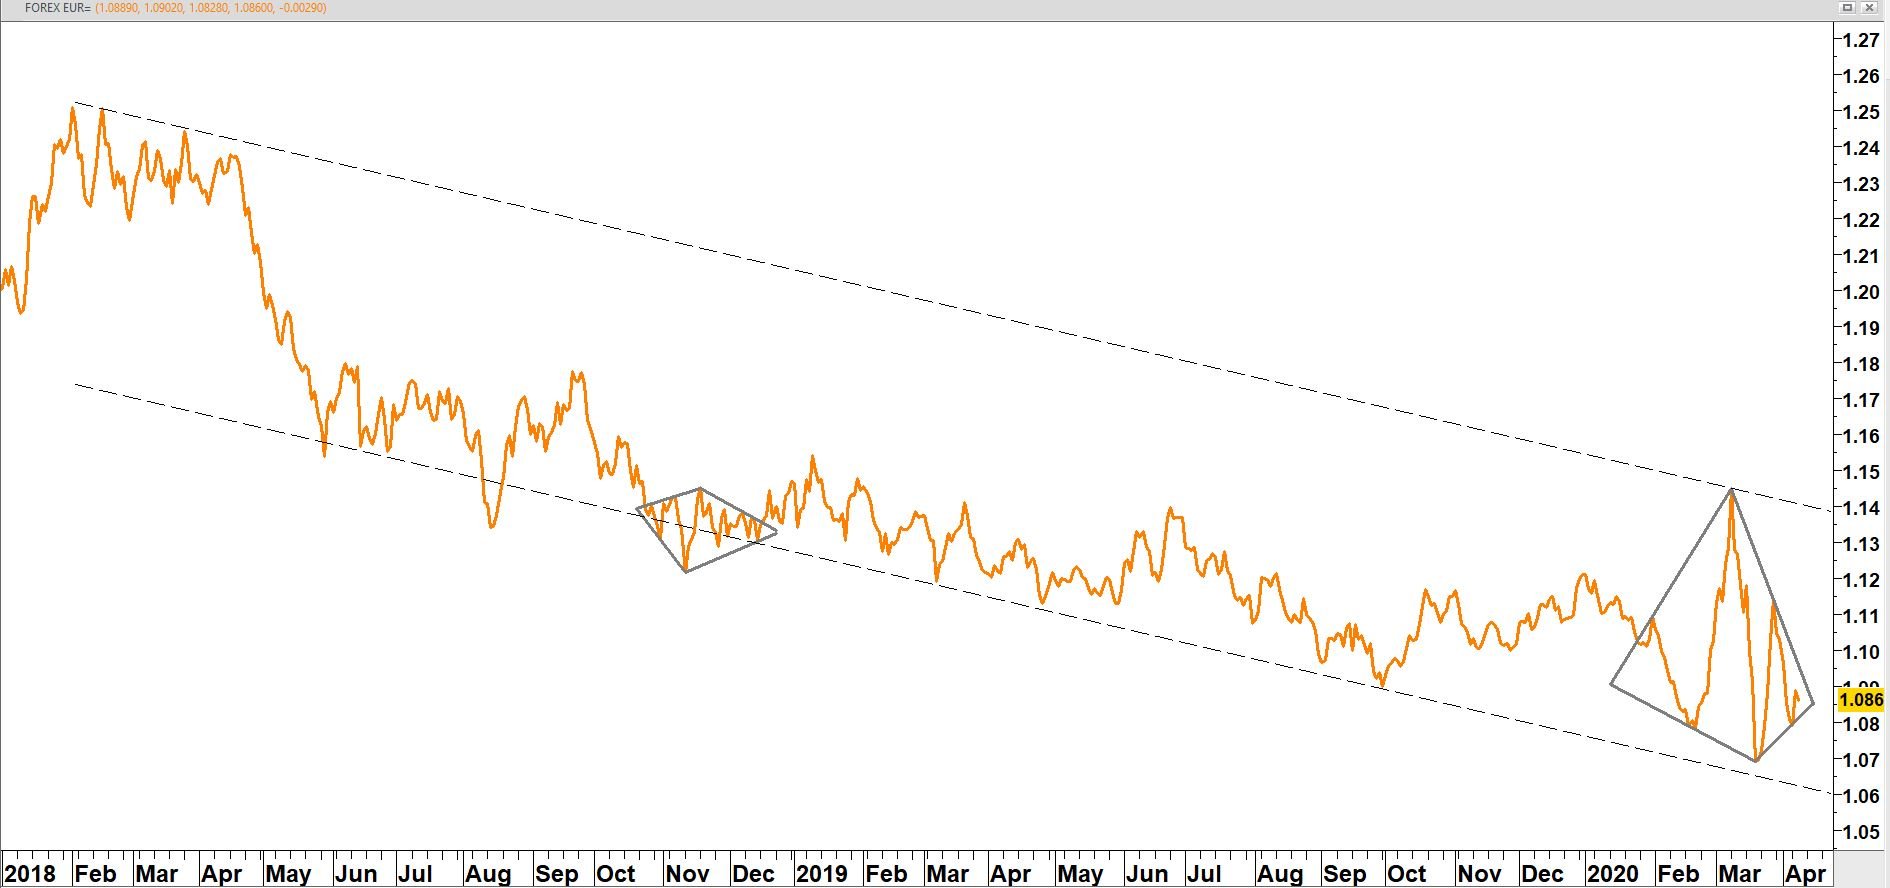
EUR/USD
Diamond patterns are rare price patterns and are typical harbingers of treacherous market conditions.
EUR/USD since 2018
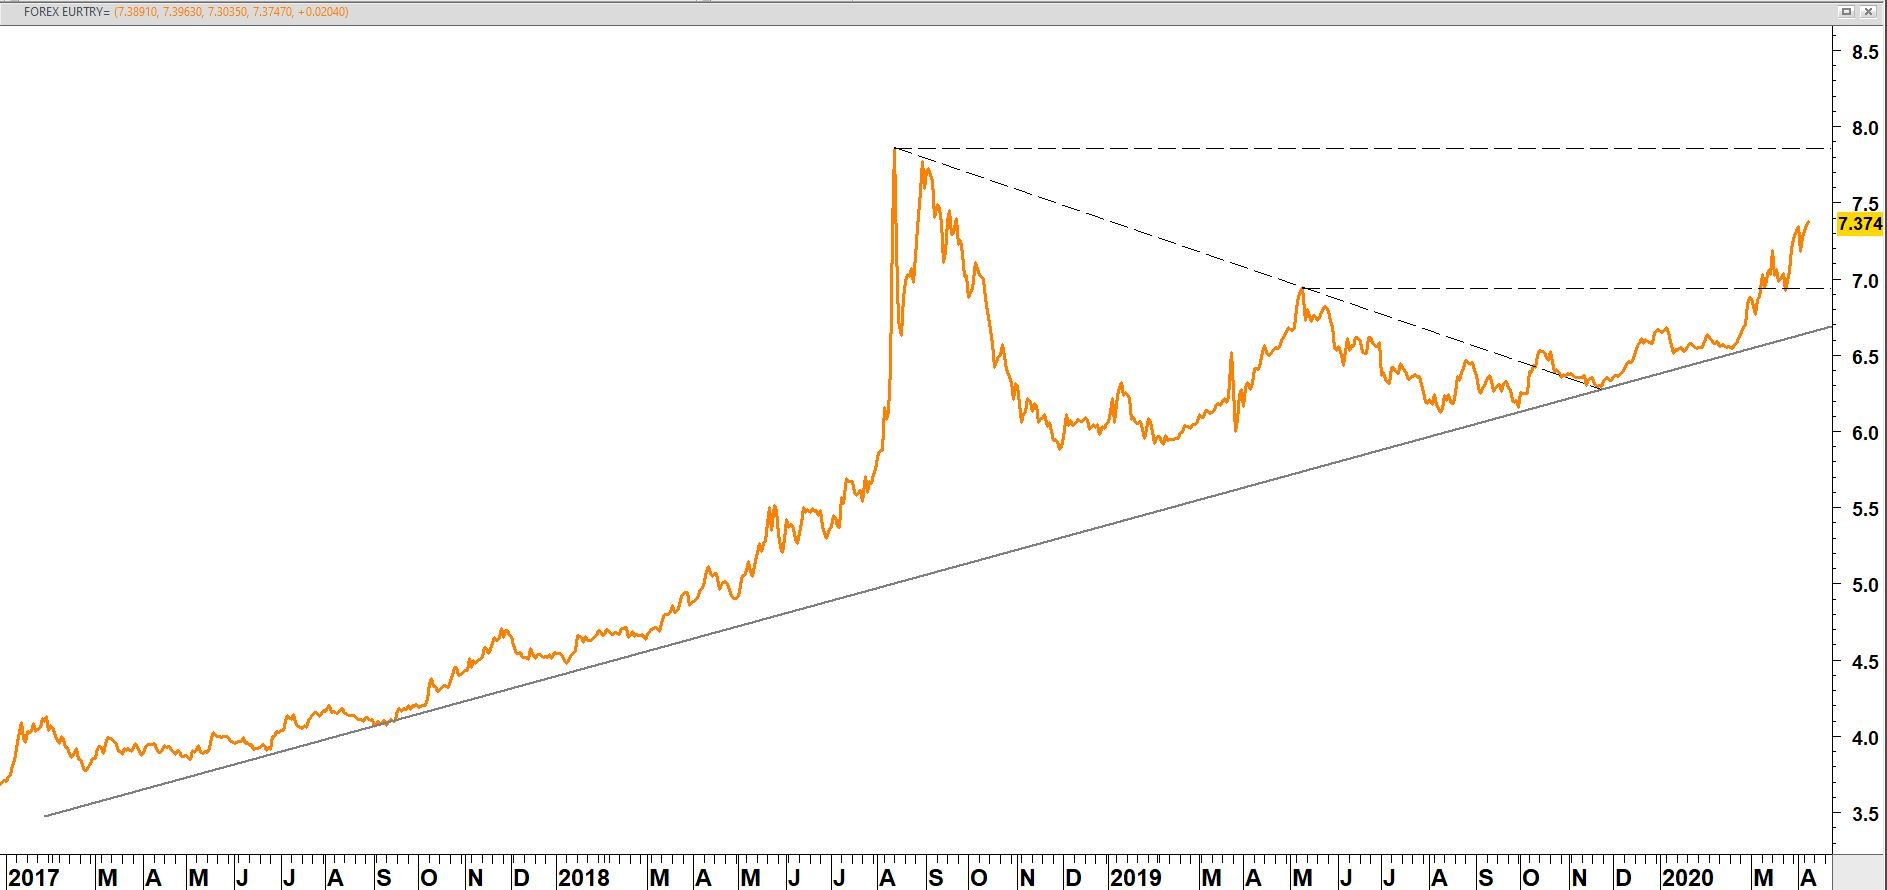
EUR/TRY
The euro used the support line, which has been rising for several years, as a springboard for a new rally in regard of the Turkish Lira.
EUR/TRY since 2017
This marketing information was compiled by Edward Loef (mail@edwardloef.com). This blog post reflects Edward Loef's opinion in his capacity as Certified Financial Technician. This information is not intended as professional investment advice or as a recommendation to make certain investments through iBanFirst. It is intended as information provided to private individuals and not as advice for making commercial decisions. The information is explicitly not intended as an offer to buy or sell products. If you enter into a transaction with iBanFirst, we strongly advise you to determine the relevance of this information to your transaction and to take into account your experience, knowledge, financial capabilities, investment objectives and risk appetite.