
As a CFO, your Board and CEO probably ask you tougher questions than ever as your business grows. And fumbling an important question because you don't have the right financial KPI is a nightmare you'd rather avoid.
Financial KPIs, or numbers derived from accounting, revenue, and asset data, tell you how your company has performed so far and help you prepare for the future. In short, they tell you where you've been and where you're likely headed.
Identifying the right financial KPIs to track is a critical CFO skill. When wondering which KPIs CFOs must track, you'll usually get hit with a long list of ratios and metrics. However, you must take the time to identify the right KPIs for your business's goals before creating a list of them to track.
Here's how you can categorise and create the right financial KPIs that give you answers when you need them.
How to align financial KPIs with business goals
It's crucial to get your KPIs right from the outset to avoid misalignment. "You may select KPIs that are not aligned with the company's strategic objectives, leading to a disconnect between what is measured and what is important for the business," says Chris Martinez, Finance Analytics Manager at The Kraft Heinz Company.
He also points to "focusing solely on lagging indicators, like past quarter sales, instead of incorporating leading indicators, like sales pipeline," as another KPI-related mistake CFOs make.
Modern CFOs must have the skills and data to deliver actionable insights, not just reports. Your KPIs must help you tell a story to stakeholders if you want to make a positive impact. So how do you align your KPIs with business goals?
Bernie Smith, Author of KPI Checklists and Consultant at Made to Measure KPIs, offered this view:
"After running lots and lots of strategy sessions, I realised there are six fundamental strategic objectives that almost every commercial organisation strives to achieve: Be profitable, stay solvent, grow, strive for innovation, manage risk, and be compliant."
Categorise your KPIs according to these categories, and you'll automatically align them with your business goals. These categories also make sifting through KPI lists easy.
Here are the most important KPIs you must track:
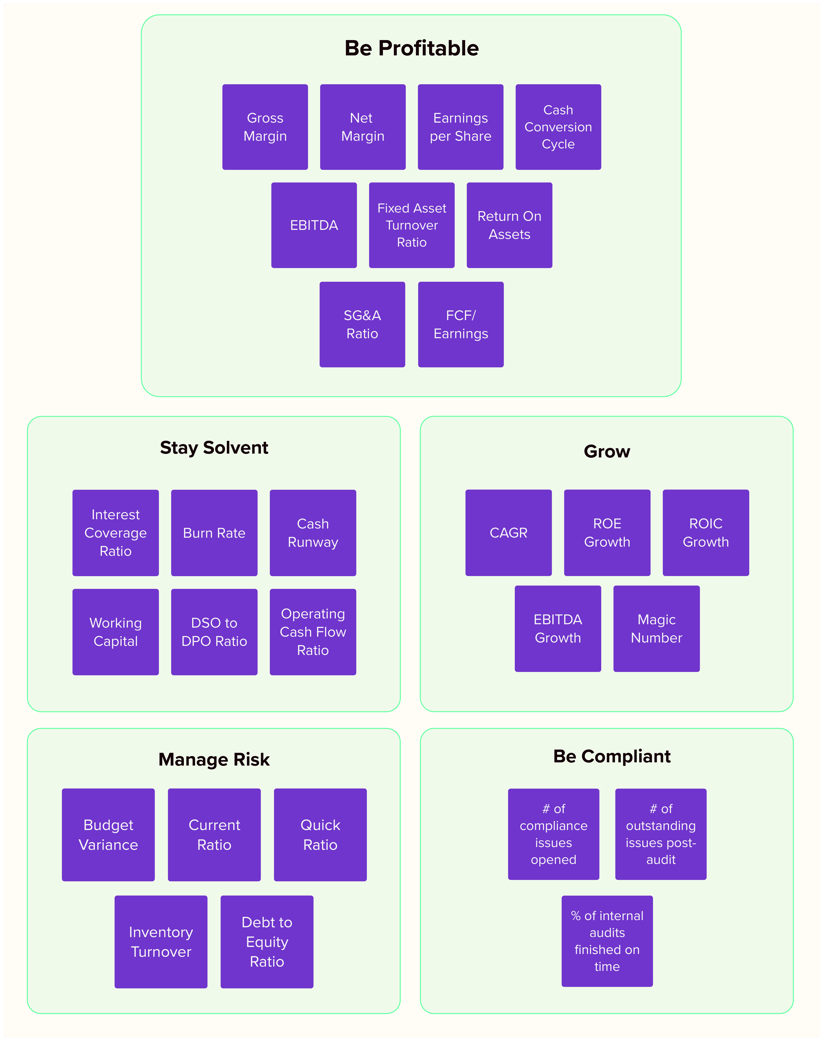
Financial KPIs categorised according to strategic business objectives.
Financial KPIs to focus on profitability
These financial KPIs tell CFOs how profitable their companies are and how efficiently they're turning resources invested into profit.
1. Gross profit margin
Gross profit margin measures the percentage of revenue your business keeps after paying for the cost of goods sold. This metric shows how efficiently you produce your core products or services before accounting for operating expenses.
Formula:
Gross Margin = (Revenue - Cost of Goods Sold) / Revenue
2. Net profit margin
Net profit margin represents the percentage of revenue that remains as profit after your business pays all expenses, taxes, and costs. This metric reveals your company's overall profitability and how well you control all business costs.
Formula:
Net Margin = Net Income / Revenue.
3. EPS
Earnings per share (EPS) calculates the portion of your company's profit allocated to each outstanding share of common stock. This metric helps you track how much profit your business generates for each share held by owners.
Formula:
EPS = (Net Income - Dividends on Preferred Stock) / Weighted Average Number of Shares Outstanding
4. Cash conversion cycle
The cash conversion cycle measures how long it takes your business to convert inventory investments into cash receipts from sales. This metric shows how efficiently you manage working capital and cash flow timing.
Formula:
Cash Conversion Cycle = Days Sales Outstanding (DSO) + Days Inventory Outstanding (DIO) - Days Payables Outstanding (DPO)
5. EBITDA
EBITDA represents your business's earnings before interest, taxes, depreciation, and amortisation are deducted. This metric provides a clear view of your operational performance by removing the effects of financing and accounting decisions.
Formula:
EBITDA = Net Income + Interest + Taxes + Depreciation + Amortisation
6. Fixed asset turnover ratio
The fixed asset turnover ratio measures how efficiently your business uses its fixed assets to generate revenue. This metric shows how well you convert long-term investments like equipment and property into sales.
Formula:
Fixed Asset Turnover Ratio = Revenue / Net Fixed Assets
7. Return on assets
Return on assets (ROA) measures how effectively your business uses its total assets to generate profit. This metric shows your efficiency in converting company resources into earnings.
Formula:
ROA = Net Income / Average Total Assets
8. SG&A ratio
The SG&A ratio measures your selling, general, and administrative expenses as a percentage of total revenue. This metric shows how efficiently you manage overhead costs relative to your sales.
Formula:
SG&A Ratio = (SG&A Expenses / Revenue) * 100
9. FCF/earnings
The FCF to earnings ratio compares your free cash flow to net income to measure earnings quality. This metric shows what percentage of your reported earnings actually converts to usable cash.
Formula:
Free Cash Flow / Net Income
Financial KPIs to focus on solvency
These KPIs measure your ability to meet business expenditures, both operational and capital.
10. Interest coverage ratio
The interest coverage ratio measures your business's ability to pay interest on outstanding debt using current earnings. This metric shows whether you generate sufficient profits to service your debt obligations without financial strain.
Formula:
Interest Coverage Ratio = EBIT / Interest Expense
11. Burn rate
Burn rate measures how quickly your business spends cash reserves during a specific period. This metric shows the rate at which you consume available funds to cover operating expenses and reveals your cash spending velocity.
Formula:
Burn Rate = (Beginning Cash - Ending Cash) / Number of Months
12. Cash runway
Cash runway calculates how many months your business can operate with current cash reserves at the existing burn rate. This metric shows how long you can survive without additional funding or increased revenue.
Formula:
Cash Runway = Cash Balance / Monthly Burn Rate
13. Working capital
Working capital measures your business's short-term financial health by calculating the difference between current assets and current liabilities. This metric shows whether you have sufficient liquid assets to cover immediate obligations and operational needs.
-
Formula:
Working Capital = Current Assets - Current Liabilities
-
14. Days Sales Outstanding (DSO) to Days Payables Outstanding (DPO)
The DSO to DPO ratio compares how quickly your business collects receivables versus how quickly you pay suppliers. This metric shows the timing difference between cash inflows and outflows in your business cycle.
-
Formula:
DSO to DPO Ratio = DSO / DPO
-
15. Operating cash flow ratio
The operating cash flow ratio measures your business's ability to pay current liabilities using cash generated from core operations. This metric shows whether your primary business activities generate sufficient cash to cover short-term obligations.
-
Formula:
Operating Cash Flow Ratio = Operating Cash Flow / Current Liabilities
Financial KPIs to focus on growth
These KPIs for CFOs tell them how fast and efficiently their business is growing.
16. CAGR rates
Compound Annual Growth Rate (CAGR) measures the mean annual growth rate of your business metrics over a specified period. This metric shows the steady growth rate needed to reach your ending value from your beginning value across multiple years.
Formula:
CAGR = (Ending Value / Beginning Value) ^ (1 / Number of Years) - 1
17. ROE growth
ROE growth measures how your return on equity changes over time by comparing the current ROE to previous periods. This metric shows whether your business is generating increasingly better returns for shareholders and improving capital efficiency.
Formula:
ROE Growth = (Current ROE - Prior ROE) / Prior ROE
18. ROIC growth
ROIC growth measures how your return on invested capital changes over time by comparing the current ROIC to previous periods. This metric shows whether your business is getting better at generating returns from both equity and debt investments.
Formula:
ROIC Growth = (Current ROIC - Prior ROIC) / Prior ROIC
19. EBITDA growth
EBITDA growth measures how your earnings before interest, taxes, depreciation, and amortisation change over time. This metric shows whether your core business operations are becoming more profitable period over period.
Formula:
EBITDA Growth = (Current EBITDA - Prior EBITDA) / Prior EBITDA
20. Magic number
The magic number measures the return on investment from your sales and marketing spend by comparing new revenue to previous marketing expenses. This metric shows whether your sales and marketing efforts efficiently contribute to business growth, particularly relevant for SaaS companies.
Formula:
Magic Number = Current quarter's revenue - Previous quarter's revenue) / Previous quarter's Sales and Marketing Expense
Financial KPIs to focus on risk management
These financial KPIs measure whether your business is exposed to undue risk.
21. Budget variance
Budget variance measures the difference between your actual financial results and what you originally budgeted. This metric shows how accurately you predicted business performance and helps identify areas where costs or revenues deviated from your plan.
Formula:
Budget Variance = Actual Amount - Budgeted Amount
22. Current ratio
The current ratio measures your business's ability to pay short-term debts using current assets. This metric shows whether you have enough liquid resources to cover obligations due within the next year.
Formula:
Current Ratio = Current Assets / Current Liabilities
23. Quick ratio
The quick ratio measures your business's ability to pay current liabilities using only the most liquid assets, excluding inventory. This metric shows whether you can cover short-term obligations without relying on inventory sales.
Formula:
Quick Ratio = (Current Assets - Inventory) / Current Liabilities
24. Inventory turnover
Inventory turnover measures how quickly your business sells and replaces its inventory over a specific period. This metric shows whether you're managing stock levels efficiently or potentially tying up too much cash in unsold goods.
Formula:
Inventory Turnover = Cost of Goods Sold / Average Inventory
25. Debt to equity
Debt to equity measures the proportion of your business financing that comes from debt versus equity. This metric shows your financial risk level and whether your growth relies heavily on borrowed money rather than reinvested profits or investor capital.
Formula:
Debt to Equity Ratio = Total Debt / Shareholders' Equity
Financial KPIs to focus on compliance
These CFO KPIs measure whether your internal controls are keeping you compliant.
26. Number of compliance issues opened
The number of compliance issues opened tracks how many new regulatory or policy violations your business identifies during a specific period. This metric shows whether your internal risk controls effectively prevent compliance problems before they occur.
27. Number of outstanding issues post-audit
The number of outstanding issues post-audit measures how many compliance problems remain unresolved after your business completes internal or external audits. This metric shows your team's effectiveness at addressing identified risks and maintaining regulatory standards.
28. Percent of internal audits finished on time
Percent of internal audits finished on time measures the portion of your scheduled internal audits that are completed within their planned timeframes. This metric shows whether your audit processes run efficiently and provide timely oversight of business operations.
How to create and maintain financial KPIs
Creating and maintaining financial KPIs takes more than picking metrics from a list. The best CFOs treat their KPIs like a living system that evolves with their business and drives better decisions.
Here's how to build KPIs that work for you, not against you.
Tips to create and maintain financial KPIs
Look laterally
Often, true business drivers cannot be measured and as a result, you cannot create a KPI for it. Smith advises against giving up on it.
"Do not reject something just because it appears to be impossible to measure. Think laterally. Take a look at the measure and think about what else happens when that thing happens."
Sometimes, a lack of measurement is a data problem. "Evaluate the data sources available and the quality of the data," counsels Martinez. " This ensures accurate and reliable measurement."
Structuring your finance department correctly by hiring for the right roles helps you assimilate insights in your data and think outside the box in these situations.
Rate the effectiveness of your KPIs
Your business will evolve and your KPIs must change with it. Periodically reviewing your KPIs for effectiveness is a great way to ensure you're measuring the right strategic goals in your business.
Kirk Kappelhoff, Director of Strategic Finance at Drivetrain, lays out a simple model to figure out KPI effectiveness. “The single most useful method in determining how relevant a KPI is to your organisation is by creating a tornado chart in your forecast model,” he says. “For example, perhaps we have a list of 3 common KPIs: Customer Lifetime Value (CLV), Customer Acquisition Cost (CAC), and Churn Rate.”
“Now, if we flex these metrics up or down by a fixed range of say, 10%, we can look at the impact on net income and see which affected net income the most.” The chart below demonstrates the effect of those KPIs on net income.
In this example, CLV has the biggest impact and is the most critical KPI to track, followed by CAC and Churn Rate.
Smith lays out a detailed approach to sifting, shortlisting, and scoring KPIs. While the full process might seem a bit much (even if you use AI assistance), Smith's recommendations for categorising KPIs based on data availability are relevant.
"If you can measure something that others find hard to measure, then it can be a ‘gold bar’ for your business," he says. "Keep an eye on these and commit to moving one or two into the ‘Primary KPIs’ bucket in the future."
Account for the international context
When operating internationally, there are additional layers of complexity that CFOs must be aware of.
For instance, currency risk management becomes all-important when trading across international borders. Setting KPIs like FX budget rates is critical to achieving this goal.
"Cultural relevance, compliance with local laws, and ensuring you've localised KPIs are essential tasks." Martinez adds.
Referring to compliance, he points out that data collection practices that fuel a KPI might put you on the wrong side of local data privacy laws. Similarly, you must develop localised KPIs that reflect the needs of a local market and balance them with global standardised KPIs.
Kappelhoff adds, “The most important piece of judging KPIs is ensuring an apples-to-apples comparison. If there is a tax implication or policy-based regulatory impact to that KPI it will have to be adjusted in one region or the other to ensure the apples-to-apples comparison is still valid.”
He lists an example. “If one country calculates gross margin to include consulting fees but another country does not, then we do not have an apples-to-apples comparison. So consulting fees would either have to be added to one region or subtracted from the other to get a valid comparison of gross margin across regions.”
Context across geographies matters. Make sure you are not imposing blanket KPIs on your business that measure nothing.
Embrace electronic dashboards
Navigating a labyrinth of spreadsheets and tabs for data is the last thing you want. That’s where electronic dashboards step in, helping you quickly gather and review your KPIs in a single pane of glass, summarising business performance. Here are a few examples of KPI dashboards designed specifically for CFOs.
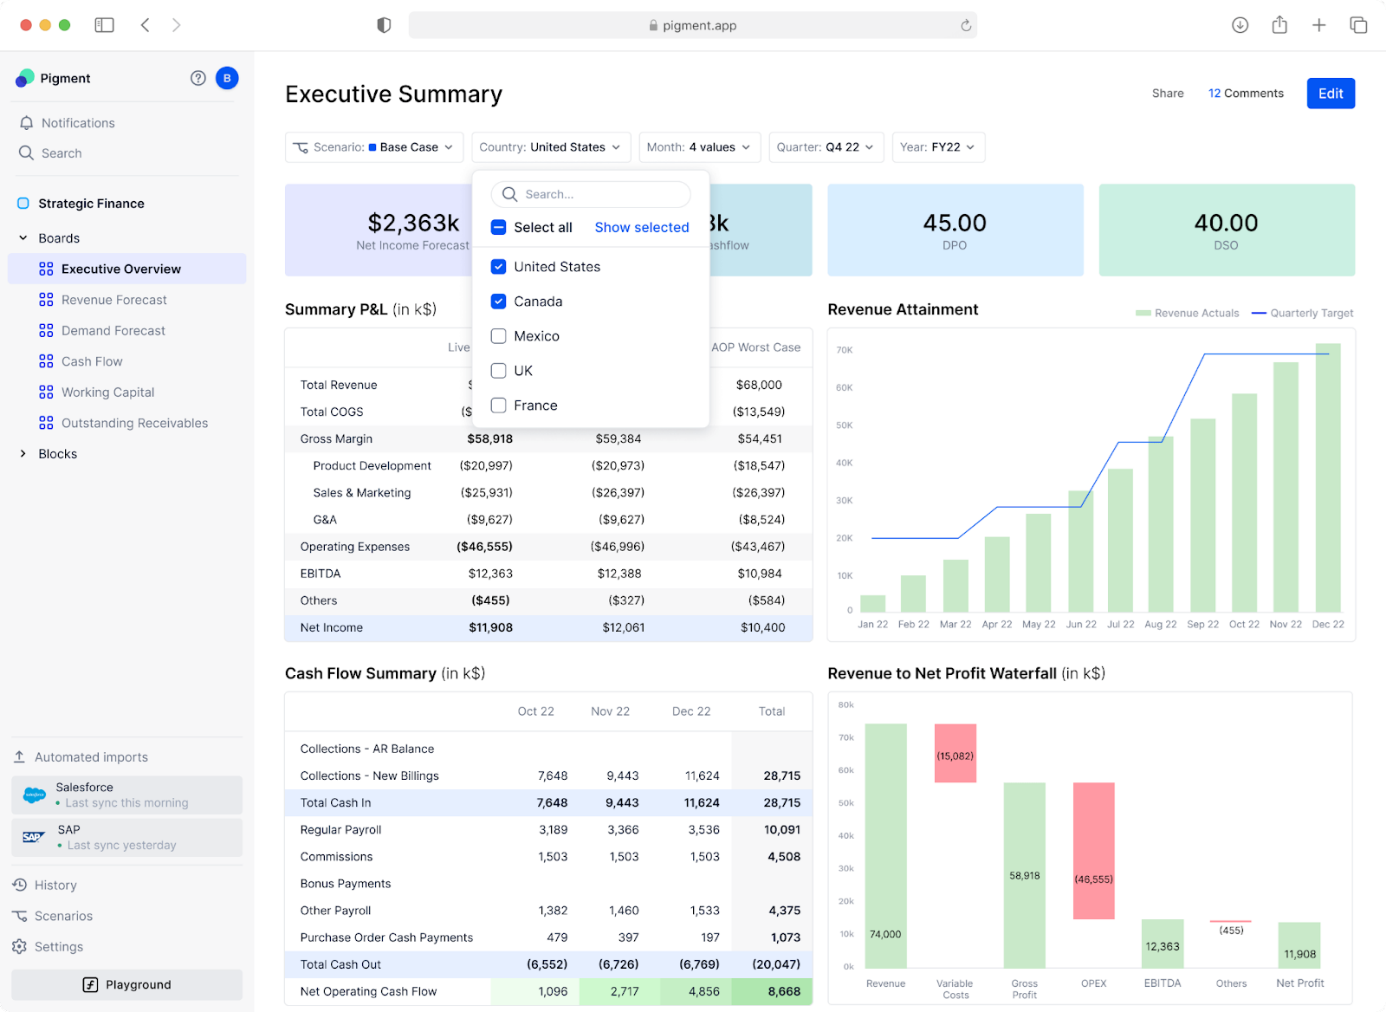
A financial dashboard with key financial information for CFOs. Courtesy: Pigment
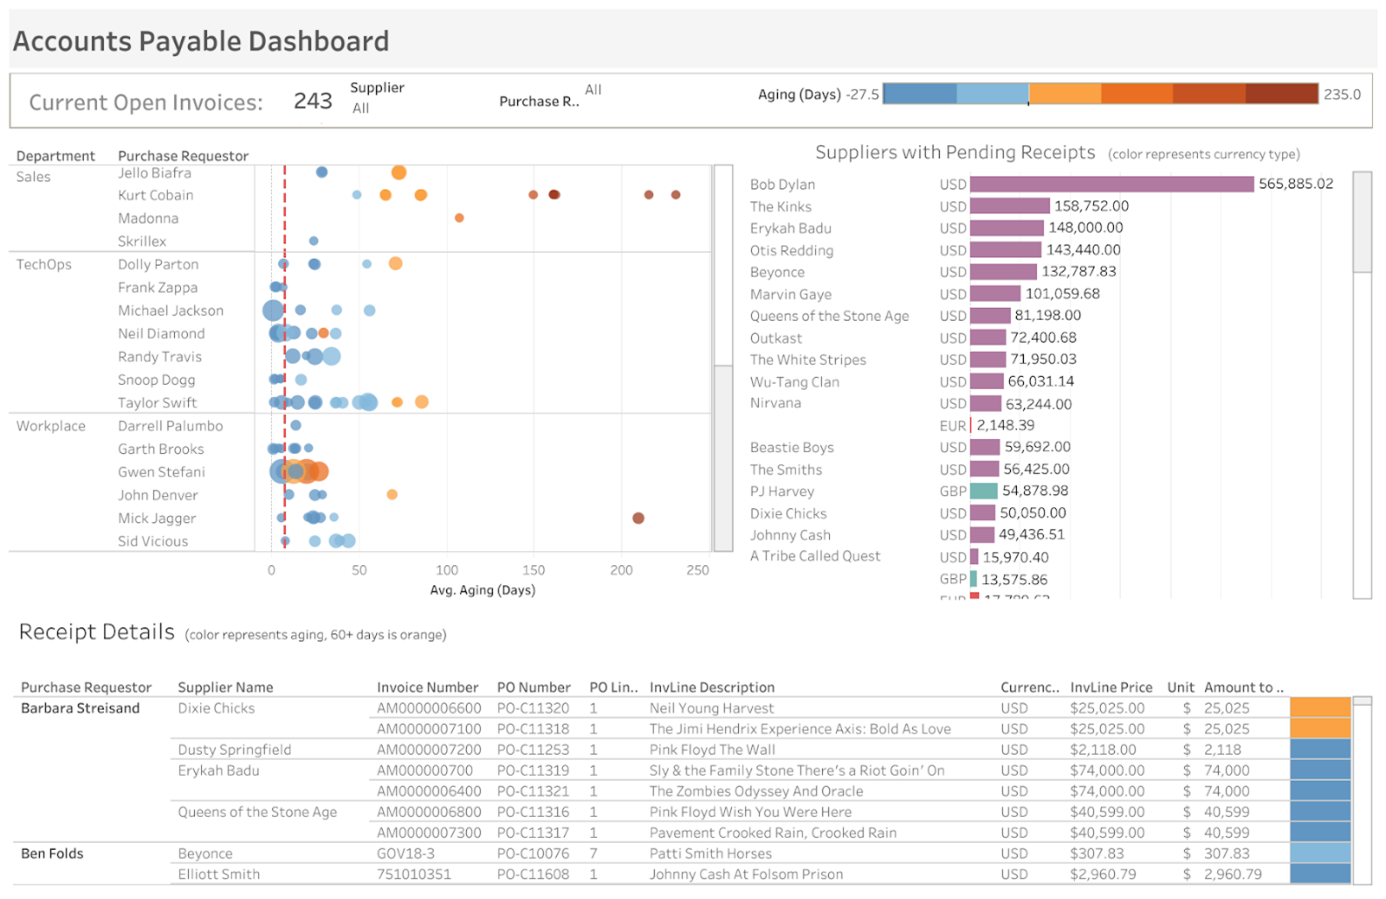
A financial dashboard highlighting accounts payable. Courtesy: Tableau
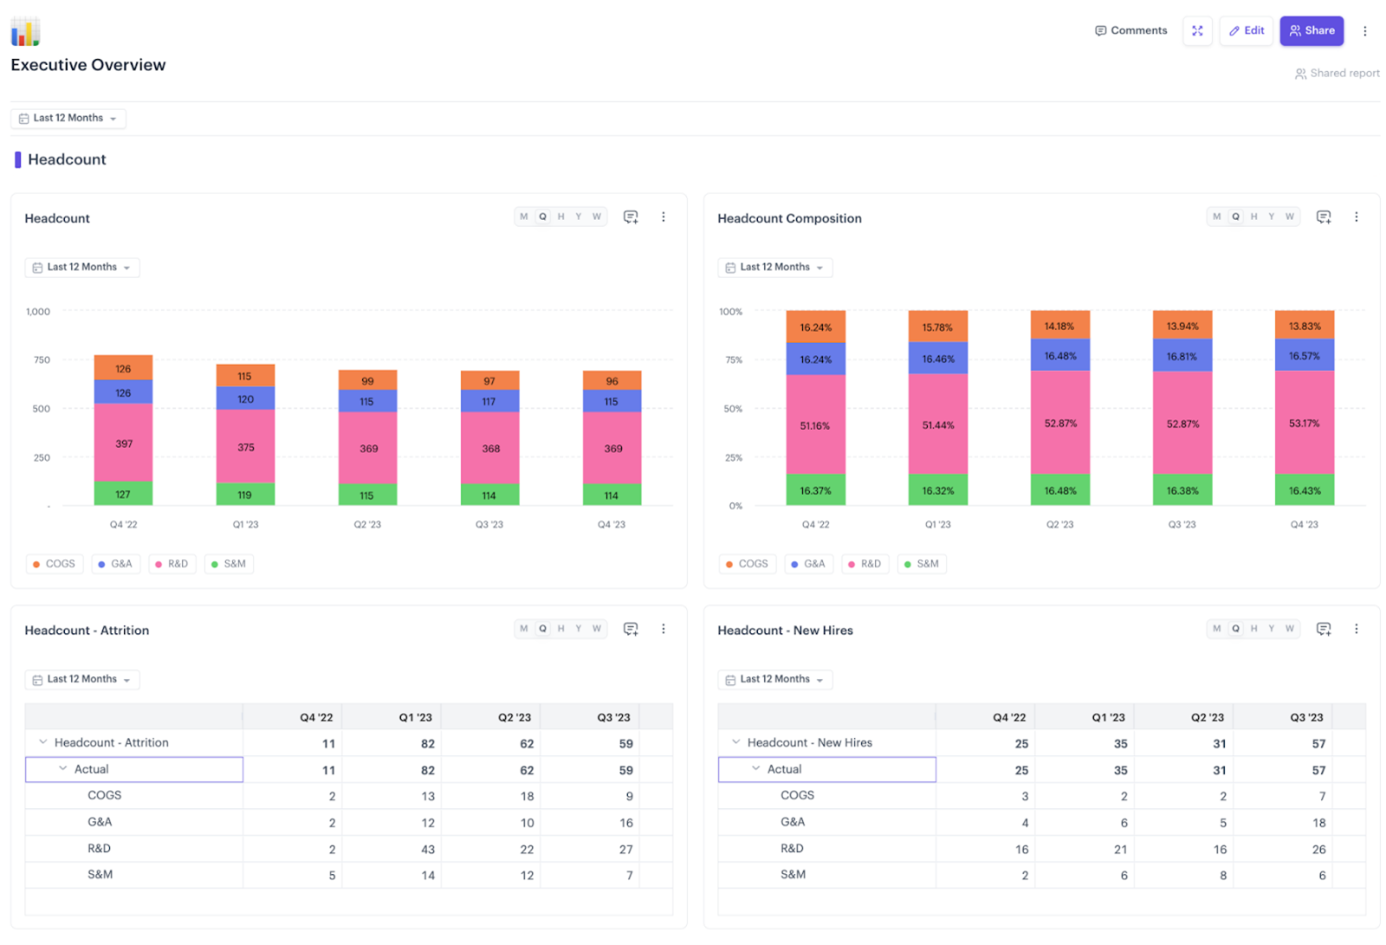
A CFO dashboard highlighting expenses related to headcount. Courtesy: Drivetrain
The bottom line
As a CFO, KPIs are the nuts and bolts of your success. When used effectively, they'll help you make smarter, data-driven decisions, spot business risks in advance, and build agility into your processes.
However, to avoid diluting your focus, cherry-pick the KPIs you deem most relevant to your company’s priorities and goals.
And for added efficiency, look into the financial tools and cross-border payment providers that provide you with access to accurate data in real time.