
The EUR/GBP currency pair has become something of a plaything, reflecting political conflicts, economic challenges and, of course, changing sentiments in the United Kingdom and the European Union over the last few years.
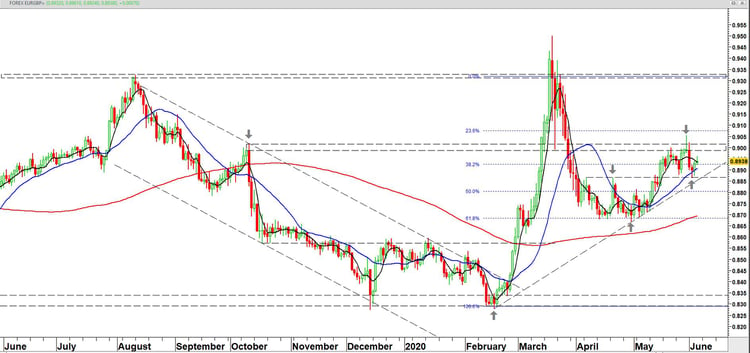
The upshot of all this is an exchange rate that has been fluctuating between EUR/GBP 0.83 and EUR/GBP 0.93 for many years. In the past 12 months alone, the pair has both hit rock bottom and gone sky high in a frenetic pendulum swing (see graph). There are several fundamental arguments both for and against this, but technical analysis is not intended to serve as an explanation for such causes.
Fortunately, the results of all supply and demand forces can be controlled, to a certain extent, using a number of techniques. One of these is the ratio between upward and downward motions. The last drop in the EUR/GBP pair, which occurred between mid-March and mid-April this year, bottomed out at the so-called Fibonacci retracement level of 61.8%. This ratio is obtained by dividing the following numbers in succession: 1, 1, 2, 3, 5, 8, 13, 21, 34, 55, and so on. It reflects a mathematical phenomenon that occurs in numerous processes of growth and decay in nature.
A second technique connects positions at the bottom of the graph. Thus, a rising support line develops from the trough in February alongside the troughs seen at the end of April. The trend above this support line is currently positive at around EUR/GBP 0.8850. A third technique is the derived average of EUR/GBP. The rising 120-day average, in red, shows an upward gradient. This indicates progressive, positive forces to the euro’s advantage against the pound sterling. The same applies to the rising 20-day average, in blue, where the same conclusion is drawn in the short-term, with the line reaching above EUR/GBP 0.89.
A fourth technique shows a recent trough identifiable near a peak that was reached in April. Market stakeholders took advantage of the recent return to this peak to buy EUR/GBP. In conclusion, the falling 5-day average now points towards a temporary wavering between EUR/GBP 0.8864 and EUR/GBP 0.90.
EUR/GBP as of June 2019 + 20/120-day averages
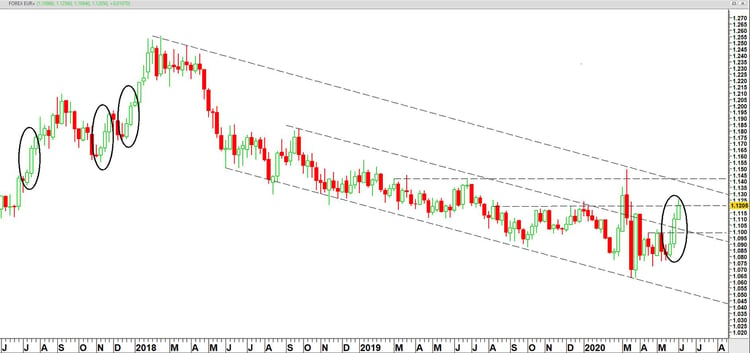
EUR/USD exhibits resilience
Within a long-term downward trend, the euro is experiencing three positive weeks in succession. That usually points to a positive continuation of this trend.
EUR/USD as of June 2017
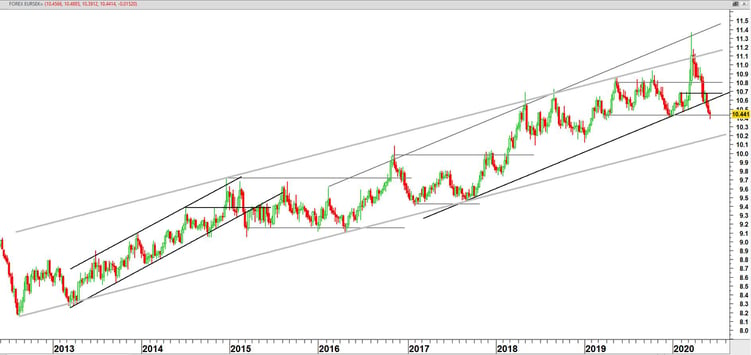
EUR/SEK tests the waters at the bottom
The multi-year long-term trend of the euro against the Swedish krona remains intact. The bottom of the rising trend channel below EUR/SEK 10.40 is coming into view at around EUR/SEK 10.20.
EUR/SEK as of June 2012
This marketing information was compiled by Edward Loef (mail@edwardloef.com). This blog post reflects Edward Loef's opinion in his capacity as Certified Financial Technician. This information is not intended as professional investment advice or as a recommendation to make certain investments through iBanFirst. It is intended as information provided to private individuals and not as advice for making commercial decisions. The information is explicitly not intended as an offer to buy or sell products. If you enter into a transaction with iBanFirst, we strongly advise you to determine the relevance of this information to your transaction and to take into account your experience, knowledge, financial capabilities, investment objectives and risk appetite.